اندیشهفلسفهخردگفتگوحکمتمعناپرسشفرهنگ
Sociology
New Research: Less Participation, More Protest
An analysis of the drop in voter turnout in the 2019 and 2021 elections shows that a 'crisis of political representation' is the cause of the emergence and persistence of protests. Rejecting the role of COVID-19, the decline in participation is the reason for the spread of discontent into widespread street protests.
The Crisis of Political Representation in Iran
Author: Alireza Kadivar (Statistics Graduate and Data Analyst)
Source: A Minute for Reflection (Daghigheh Analytical Magazine)
For nearly a hundred days, many parts of the country have been the scene of protesting people. These protests have lasted longer than those that occurred in previous years, and for this reason, it can be said they are more deep-rooted than what came before. So far, many sociologists have explained the causes of these protests by relying on concepts such as "the disruption of the relationship between power and responsibility," "the irreconcilability of the image of the future," and "the accumulation of discontent"[1]. Although these explanations offer an account of the social factors behind the emergence of protest, they are not specific to the 1401 protests, and their traces could be found in the country's ongoing events and procedures before this as well. For this reason, the distinguishing features of these protests cannot be explained by relying solely on these concepts. To explain these protests, in addition to the aforementioned social causes, one must look for causes whose role has specifically increased in recent years.
The following text attempts, by analyzing the decline in electoral votes in recent years and comparing its magnitude in protesting and non-protesting areas, to propose the loss of "political representation" as one of the most important factors for understanding the reasons behind the emergence, persistence, and intensification of these protests, and their occasional turn to violence. This approach explains how a protest with a social origin could suddenly spread to other issues and expand across different parts of the country, from Sistan and Baluchestan to West Azerbaijan and Kurdistan.
Political representation means giving renewed presence to the inhabitants of a land in the decisions made for the administration of public affairs. More precisely, political representation consists of activities that make the voices, opinions, and perspectives of citizens visible in public policymaking processes. Although this definition has weaknesses and does not encompass all issues related to political representation, it nonetheless provides an initial framework for understanding this concept[2].
The crisis of political representation in the official political sphere in Iran has intensified in recent years. The first serious signs of this crisis can be observed in the votes for the eleventh parliamentary elections in 1398.
The Decline in Votes in the 1398 Parliamentary Elections
If we base our calculation on the trend of changes in the total number of votes cast in the country in parliamentary elections prior to 1398, given the increase in the eligible voting population, it was expected that an average of 569,000 votes would be added to the total votes in each election, and the number of votes in 1398 would reach 34.9 million[3]. However, the total number of votes cast by voters in the parliamentary elections that year was approximately 10.4 million votes less than the expected amount (5 standard deviations). The total number of votes cast that year was 24.5 million (30% less than the expected amount) [4].
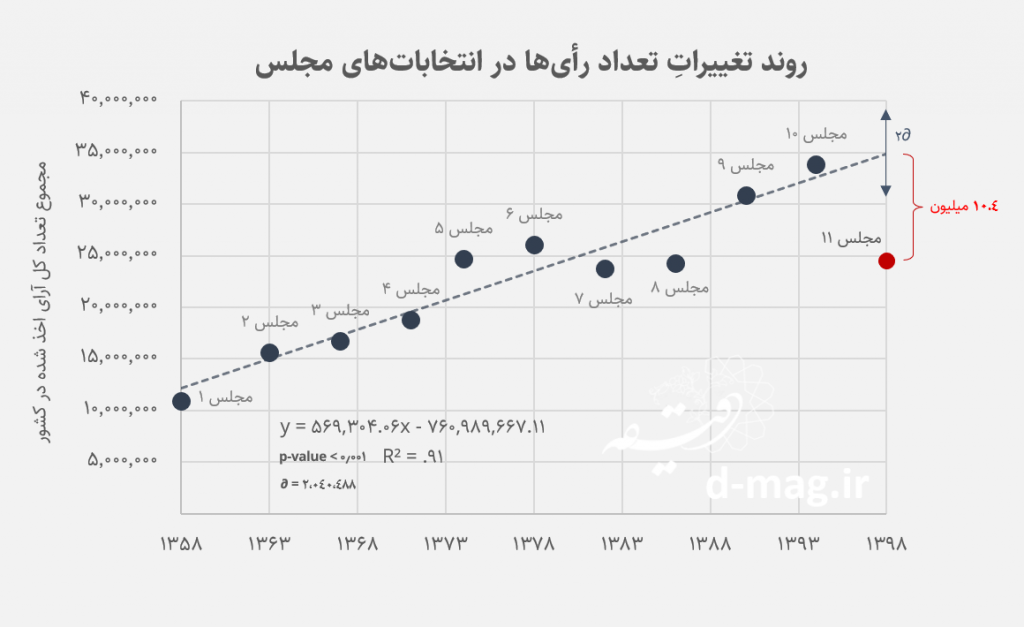
If this difference were less than 2 standard deviations, according to the divisions of the normal distribution, it could be considered more or less natural, but differences exceeding that, such as a difference equivalent to 5 standard deviations, indicate that something systematic has occurred in one of the most important official mechanisms of political representation in the country[5].
| Election Name | Date Held | Number of Eligible Voters | Number of Votes Cast | Turnout Percentage |
| Parliament 1 | 14 March 1980 | 20,857,391 | 10,875,969 | 52.14 |
| Parliament 2 | 15 April 1984 | 24,143,498 | 15,607,306 | 64.64 |
| Parliament 3 | 8 April 1988 | 27,986,736 | 16,714,281 | 59.72 |
| Parliament 4 | 10 April 1992 | 32,465,558 | 18,767,042 | 57.81 |
| Parliament 5 | 8 March 1996 | 34,716,000 | 24,682,386 | 71.1 |
| Parliament 6 | 18 February 2000 | 38,726,431 | 26,082,157 | 67.35 |
| Parliament 7 | 20 February 2004 | 46,351,032 | 23,734,677 | 51.21 |
| Parliament 8 | 14 March 2008 | 43,824,254 | 24,279,717 | 55.4 |
| Parliament 9 | 2 March 2012 | 48,288,799 | 30,844,462 | 63.87 |
| Parliament 10 | 26 February 2016 | 54,915,024 | 33,847,117 | 61.64 |
| Parliament 11 | 21 February 2020 | 57,918,159 | 24,512,404 | 43 |
Was COVID the Most Important Factor in the Decline in Votes?
One might imagine that the systematic event that contributed most to the decline in electoral votes in 2020 was the COVID pandemic, but there is considerable evidence to the contrary. The 2020 elections were held after the bloody crackdown on protesters in November of that year and the downing of the Ukrainian airliner in January. According to ISPA polls, the estimated turnout for the elections before the shooting down of the Ukrainian plane was 47%, but it dropped to 36% afterward.[6] A similar effect on the decline in votes, and perhaps even greater given the broader dimensions of the event, can be imagined in the government's handling of the November 2019 protests.
The parliamentary elections were held on 21 February 2020, at a time when the fear of COVID had just begun in Iran and little time had passed since the official announcement of the outbreak in the country. Yet this pattern was more or less observed 16 months later, in June 2021, during the 13th presidential election.
Decline in Votes in the 2021 Presidential Election
If we take the trend of changes in the total number of votes cast in the country in presidential elections up to the year 2021 as a basis for calculation, given the increase in the eligible voting population, it was expected that an average of 750,000 votes would be added to the total votes in each election, and the number of votes in 2021 would reach 43.5 million.[7] However, the total number of votes cast by voters in the presidential election that year was approximately 14.5 million less than the expected amount (4.7 times the standard deviation). The total number of votes cast that year was 29 million (33% less than the expected amount).
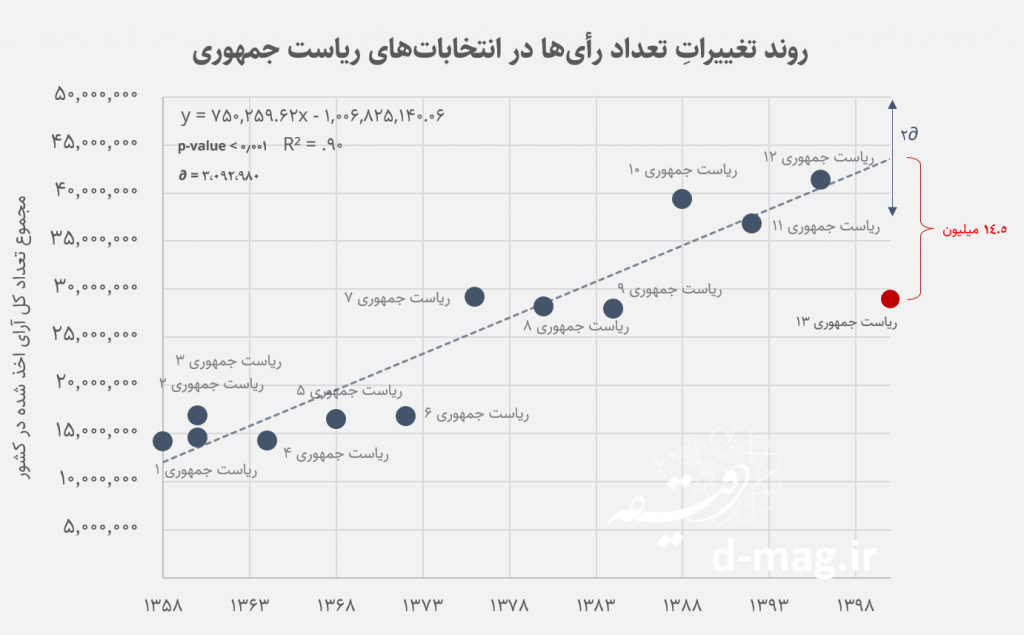
As can be seen, the decline in votes in the 2021 presidential election is no better than the decline in votes in the 2020 parliamentary election. Whether we take the absolute difference in votes from the expected amount or its ratio to the expected amount as a basis, it can be said that the electoral decline of 2021, compared to the presidential elections before it, was even larger than the electoral decline of 2020.
Invalid Votes: A Protest Unheard
It should also not be forgotten that the number of invalid votes in the 1400 election was unprecedentedly high. In the thirteenth presidential election, 3.7 million blank votes or votes containing names other than the vetted candidates were cast into the ballot boxes (equivalent to 13% of the total votes). This number was more than three times greater than the highest number of invalid votes cast in previous periods. This kind of use of the ballot box itself constitutes a form of silent protest. In other words, protest action was so relevant for individuals that, to express it, they were willing to go to the polls despite the dangers of the COVID-19 pandemic.
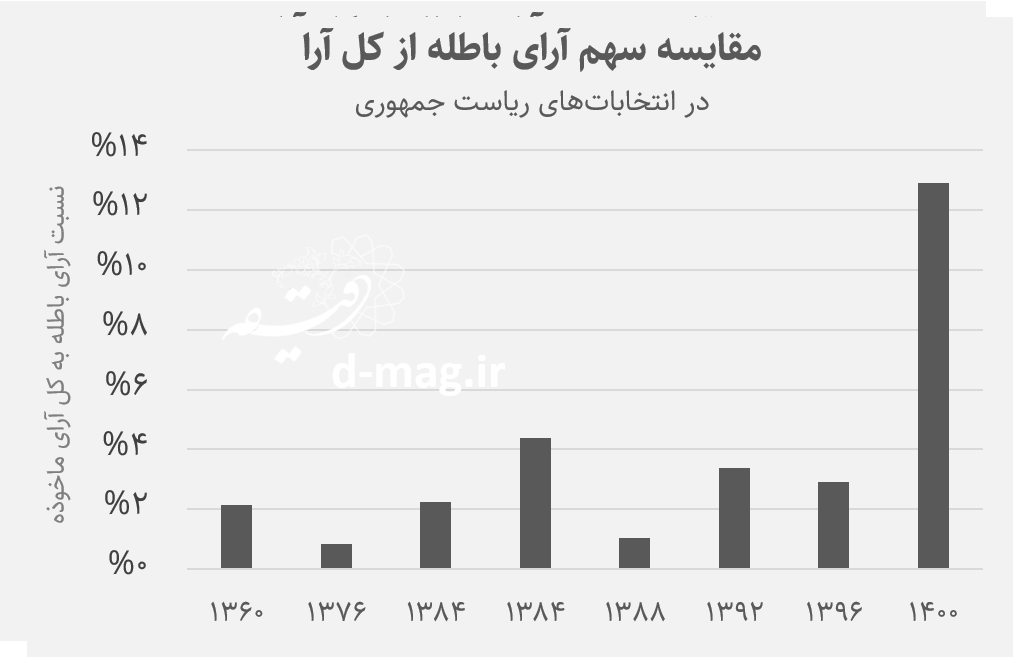
Consequently, if instead of the total votes, we take the number of valid votes as the basis for analysis, we will see that the crisis of political representation in 1400 deepened even compared to 1398[8].
This can also be inferred from the decline in participation. In the eleventh parliamentary elections in '98, political participation had decreased by 19 percentage points compared to the previous round, whereas in the thirteenth presidential election in 1400, political participation decreased by 5 percentage points more than that, i.e., 24 percentage points compared to the previous round[9].
| Election Name | Date Held | Number of Eligible Voters | Number of Votes Cast | Participation Percentage | Invalid Votes |
| Presidential 1 | 5 Bahman 1358 | 20,993,643 | 14,152,887 | 67.42 | Not found |
| Presidential 2 | 2 Mordad 1360 | 22,687,017 | 14,573,493 | 64.24 | Not found |
| Presidential 3 | 10 Mehr 1360 | 22,687,017 | 16,847,715 | 74.26 | 360269 |
| Presidential 4 | 25 Mordad 1364 | 25,993,802 | 14,238,587 | 54.78 | Not found |
| Presidential 5 | 6 Mordad 1368 | 30,139,598 | 16,452,562 | 54.59 | Not found |
| Presidential 6 | 21 Khordad 1372 | 33,156,055 | 16,796,755 | 50.66 | Not found |
| Presidential 7 | 2 Khordad 1376 | 36,466,487 | 29,145,754 | 79.93 | 240996 |
| Presidential 8 | 18 Khordad 1380 | 42,170,230 | 28,155,969 | 66.77 | Not found |
| Presidential 9 (Stage 1) | 27 Khordad 1384 | 46,786,418 | 29,400,857 | 62.84 | 663770 |
| Presidential 9 (Stage 2) | 3 Tir 1384 | 46,786,418 | 27,958,931 | 59.76 | 1224882 |
| 10th Presidential | 12 June 2009 | 46,199,997 | 39,371,214 | 84.83 | 409389 |
| 11th Presidential | 14 June 2013 | 50,483,192 | 36,821,538 | 72.94 | 1245409 |
| 12th Presidential | 19 May 2017 | 56,410,234 | 41,366,085 | 73.03 | 1200931 |
| 13th Presidential | 18 June 2021 | 59,310,307 | 28,989,529 | 48.88 | 3740688 |
* * *
As explained so far, it appears that the 10-million vote drop in the 2019 parliamentary elections and the 14-million vote drop in the 2021 presidential election were political in nature and cannot easily be attributed to factors such as the coronavirus. But this is not the whole story. A more detailed examination of the vote decline in the latest election and a comparison of its magnitude across the country's counties further reveals the nature of the crisis of political representation.
Comparing Political Representation in Protesting and Non-Protesting Areas
To compare political representation across different counties, particularly those with protests and those without, we must first quantify it. To do this, we define an index called
To classify the country’s counties into the two categories of “with protest” and “without protest,” we consulted reports of street protests published on the internet in the form of text or video on social media such as Twitter. If, between 16 September and 21 November 2022, reports of a street protest were published in any part of a county, we consider that county “with protest”; otherwise, we consider it “without protest.” For example, videos of protest gatherings in Karaj County were published, which is why we considered it “with protest.” However, no news of protest was found from Ashtian County, which is why we considered it without protest.
Out of the country’s 457 counties in 2022, protests were observed in a total of 140 counties during the aforementioned period, and no protests were observed in 317 counties[11].
Comparing Counties with and without Protest
We can now answer the question we posed earlier:
Is there a significant difference in “changes in political representation in the formal arena” observable between counties with protest and counties without protest?
If we plot the frequency distribution of “changes in political representation in the formal arena,” disaggregated by protesting and non-protesting counties, in the form of a density curve, the distinction in the state of political representation in protesting counties and counties without protest becomes clear.
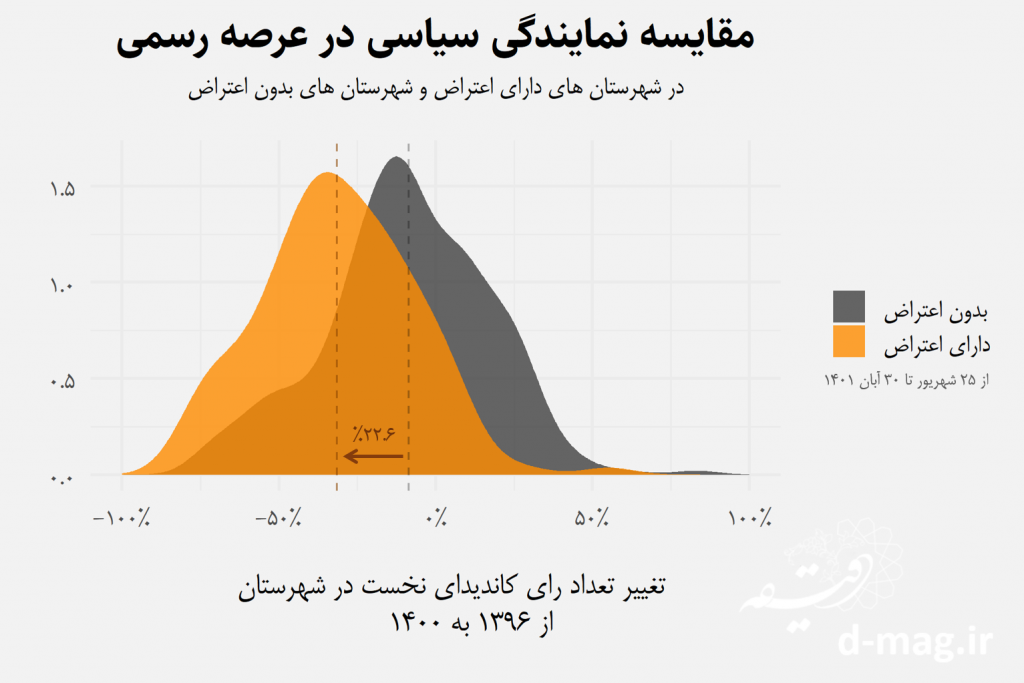
The difference in changes in political representation in the formal arena between counties with protest and without protest is statistically significant[12]. In other words, the decline in votes that occurred in protesting counties before the start of the current protests was, on average, 22.6% less than in counties without protest. Another implication of this statement is that the probability of observing protest is higher in counties where formal political representation has weakened more, and this can be cited as one of the factors explaining the outbreak of widespread protests in the country.
If the increase or decrease in political representation made no difference to the outbreak of protest, the gray and orange peaks should have more or less coincided. However, the orange peak (counties with protest) has shifted to the left of the graph, that is, toward more weakened political representations. For this reason, it can be claimed that the decline in representation in formal politics has been effective in the outbreak of protests in the last 100 days.
Protest in High-Population and Low-Population Areas
Given the different socio-political behavior in high-population and low-population counties, one might imagine that what is seen as a distinction between counties with protest and counties without protest is merely a reflection of their population. However, by introducing the population variable into this analysis, the changes in formal political representation in counties with protest and without protest remain distinct.
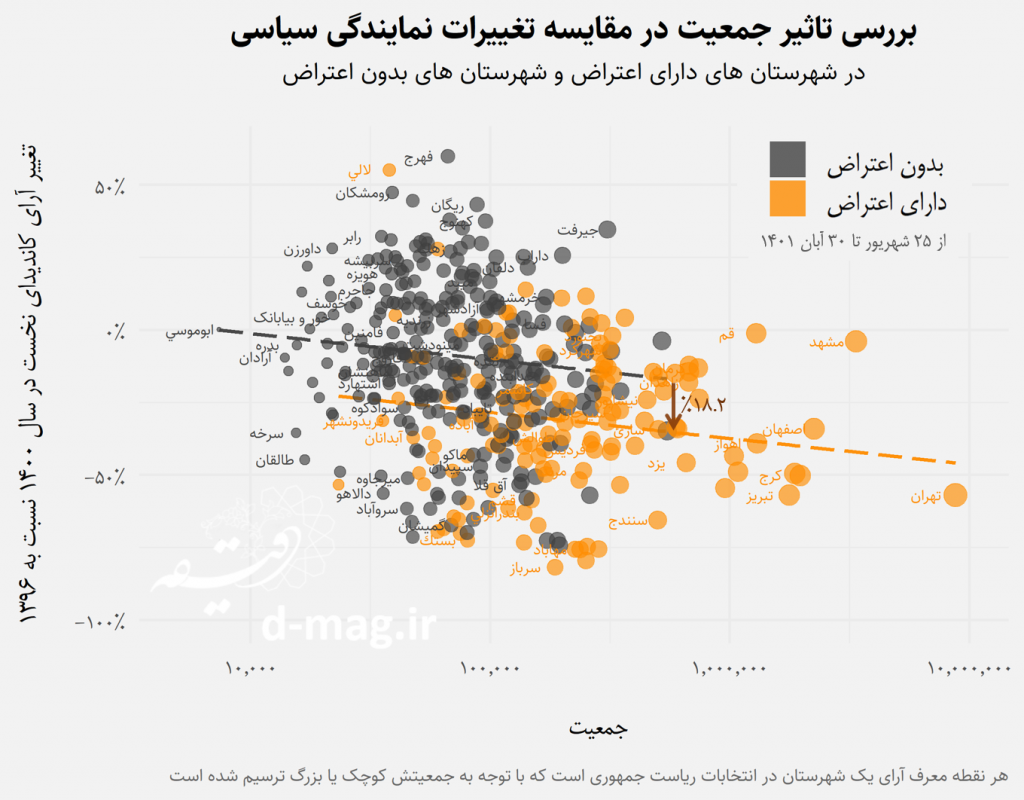
As can be seen in the chart above, political protest is more common in populous counties (as we move from right to left in the chart, i.e., from larger counties to smaller ones, the number of counties with protests decreases). Although the effect of the population variable is quite evident in the occurrence or non-occurrence of protests, it does not eliminate the effect of declining political representation in the formal sphere on protest. The drop in votes for the leading candidate in counties with protests, compared to counties without protests that have similar populations, is on average 18.2% lower (see the dashed line fitted to counties with protests (orange dots), which is 18.2 percentage points lower than the dashed line fitted to counties without protests (gray dots)[13].
Protest and Political Representation
Evidence such as the sharp decline in votes in the last two elections and its significant role in the emergence of protests indicates that the crisis of political representation in the country is serious, and there is little difference between large and small cities in this regard. If political representation is denied, protest and unrest will occur. Other social analyses and explanations from various angles have shown that deep-rooted and structural factors, such as the loss of political representation, are influential in what has occurred in the country, and it cannot be dealt with as a blind rebellion through tactics like repression and execution. Without offering a solution to revive political representation, a reliable approach to confronting the protests cannot be reached.
For a better understanding of the issue, examining the counties where the greatest decline in formal political representation has occurred, as well as the geographical distribution of this indicator across the country, will also be instructive, which will be discussed below.
Where Have the Sharpest Declines in Political Representation Occurred?
If we list the counties where the decline in political representation has been greater than 65%[14], we arrive at 22 counties, some of whose names, as it happens, have been frequently heard in the news of the protests over the past two months. In one county, this figure is more than 80%, and in 13 counties, it is more than 70%. The data for several of these counties are presented in the table below[15].
In this table, the names of some provinces, such as West Azerbaijan, Sistan and Baluchestan, Kurdistan, and Golestan, are repeated more than others. These few provinces are similar to each other in terms of characteristics such as the settlement of ethnic and religious minorities, as well as their distance from the center and their border location.
| Rank | County | Province | Votes for Leading Candidate in the 2017 Presidential Election | Votes for Leading Candidate in the 2021 Presidential Election | Indicator of Change in Political Representation in the Formal Sphere |
| 1 | Sarbaz | Sistan and Baluchestan | 65,866 | 11,937 | -81.9% |
| 2 | Bukan | West Azerbaijan | 76,587 | 15,703 | -79.5% |
| 3 | Mahabad | West Azerbaijan | 71,522 | 17,362 | -75.7% |
| 4 | Saqqez | Kurdistan | 73,854 | 17,994 | -75.6% |
| 5 | Chabahar | Sistan and Baluchestan | 103,286 | 25,214 | -75.6% |
| 6 | Iranshahr | Sistan and Baluchestan | 85,613 | 21,742 | -74.6% |
| 7 | Marivan | Kurdistan | 54,308 | 13,982 | -74.3% |
Although the decline in representation in formal politics in 1400 (2021-2022) is a general pattern across the country, a look at the common characteristics of these several provinces can be illuminating for understanding some of the internal factors behind the protests. For instance, one of the questions raised in recent months was how a protest that initially originated from social freedoms and the issue of women spread to various parts of the country, from West Azerbaijan to Sistan and Baluchestan, and encompassed other issues such as discrimination and centralism?
The sharp decline in political representation in these provinces shows why these issues were quickly added to the content of the protests. A 70% reduction in political representation is so great that we should be surprised if it did not lead to protest. This level of decline in political representation probably signifies a kind of feeling of being excluded in these regions.
Geographical Distribution of Changes in Political Representation
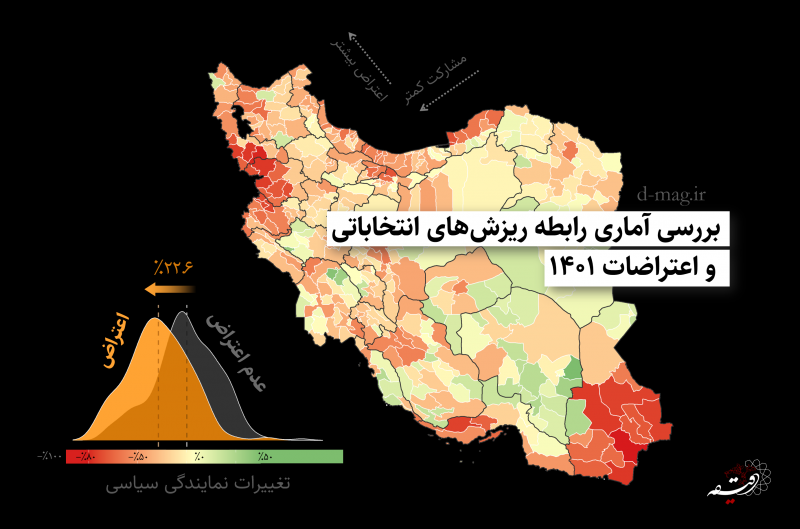
Examining the geographical dispersion of changes in political representation among the country's counties confirms the special situation of certain ethnic and religious minorities regarding the issue of political representation. As we know from previous data, and as the colored map also shows, political representation has decreased in most counties. However, the magnitude of this indicator is not distributed more or less uniformly across different locations. The political representation index has declined with greater intensity and concentration in some areas compared to others. Such concentration is seen primarily in Kurdish and Baluch-populated areas, followed by Turkmen-populated areas, Bandar Lengeh and its adjacent counties, as well as Tehran and some of its neighboring counties. In other locations, a decline in political representation is also seen in counties close to one another, but its intensity is generally less than in the aforementioned cases.
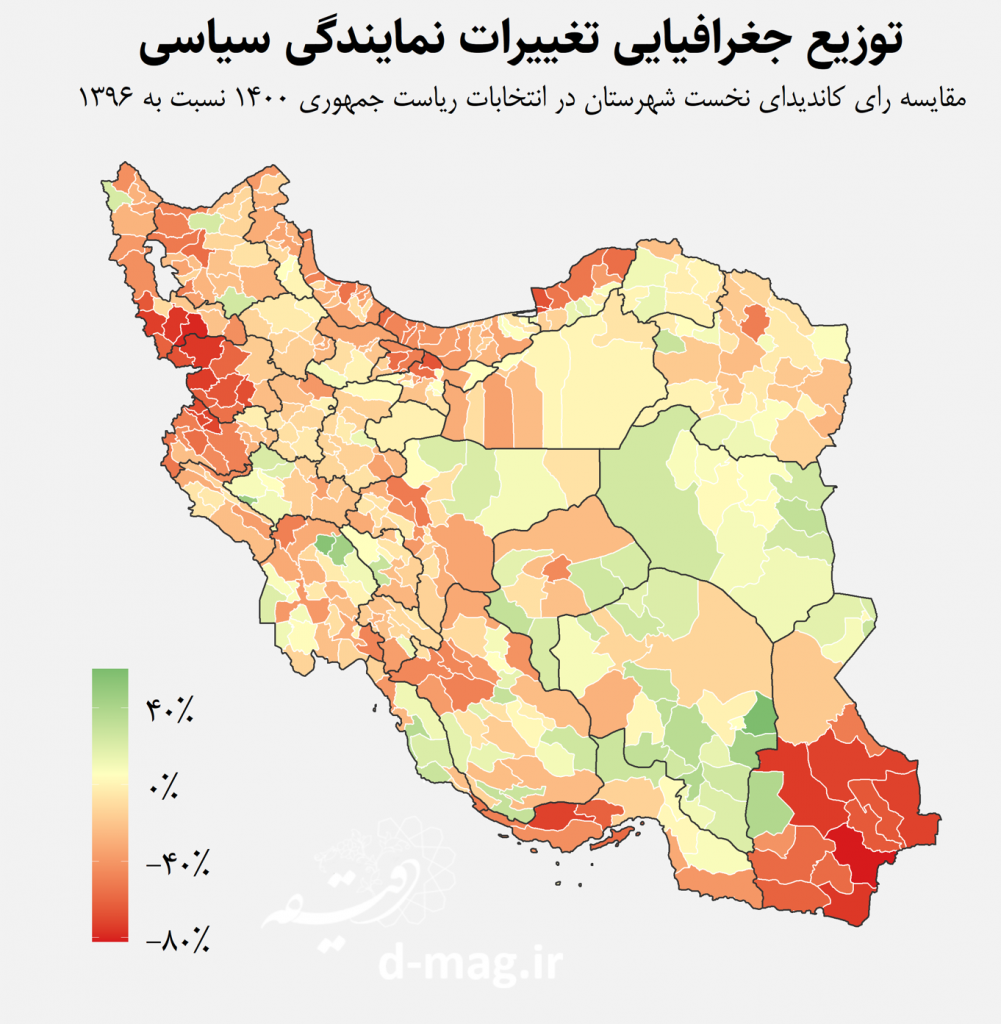
As previously mentioned, the mechanism of political representation in the formal political arena in Iran has been severely damaged. The map above shows where the intensity and concentration of this damage has been greatest.
The relative correspondence between the outbreak of greater unrest and violence in recent protests in Kurdish and Baluch regions and the main centers of political disenfranchisement (the red zones on the map above) indicates that attention to the crisis of political representation is also significant at the level of security analysis, and without devising a solution for it, the security problems that have arisen cannot be resolved.
This damage is, in fact, a cost the government has incurred for its own homogenization, and for this reason, it is difficult to consider the share of external factors and threats as greater than the share of internal factors and decisions. These observations show that the homogenization of power, contrary to achieving efficiency and progress as some portray it, confronts the country with fundamental problems and security threats.
Without political representation, governing institutions lose their function, their actions become ineffective, and they may even produce results contrary to their own goals.
.
.
Footnotes and References
[1] An excerpt from IRNA's conversation with sociologists about the recent protests; dated 19 Mehr 1401
[2] Stanford Encyclopedia of Philosophy; Political Representation, First published Mon Jan 2, 2006; substantive revision Wed Aug 29, 2018
[3] R2 = 0.91, p-value < 0.001, standard deviation = 2 million
[4] All electoral statistics used in this study have been extracted from the website of the National Election Headquarters and, after preparation, have been made publicly available here.
[5] To obtain the table of votes for different parliamentary election cycles, refer here.
[6] Predicting participation in the 1400 elections; report of a speech by the head of ISPA titled "The Configuration of Public Opinion on the Eve of Transformation; Iranian Electoral Public Opinion"; dated Ordibehesht 1400
[7] R2 = 0.90, p-value < 0.001, standard deviation = 3 million
The slope of the increase in the average number of votes in presidential elections (750,000 every four years) is greater than the slope of the increase in the average number of votes in parliamentary elections (560,000 every four years). This observation is because the general tendency of votes across the country toward presidential elections compared to parliamentary elections has increased over time for various reasons, and therefore the only factor affecting the increase in the number of votes is not population growth.
[8] Using valid votes (total votes minus invalid votes) compared to total votes seems more appropriate for analyzing “political representation” in the formal political sphere, because an invalid vote precisely indicates that the individual, despite their desire to participate in the election, did not find their desired political representative. In this analysis, total votes have been used because complete statistics for valid votes across all election periods were not available.
[9] For the vote counts of different presidential election periods, refer here.
[10] Another method for quantifying political representation in the formal sphere is using the concept of political participation. However, for several reasons, it was not used in this calculation, and comparing the vote of the leading candidate across successive election periods was preferred. First, an increase in participation with a multiplicity of candidates does not necessarily mean an increase in political representation, as it may not lead to political efficacy. Second, the denominator in calculating political participation, i.e., the number of eligible voters, is approximated using the population over 18 in the latest census and is imprecise. Third, election votes are published in various forms across different periods, and it is not always possible to calculate participation at the county level. For example, in 1400 (2021), invalid votes were not published broken down by county. However, the leading candidate's vote, since it must be announced to the public, should, as a rule, always be published.
[11] The initial version of this table was extracted from the following link: Map of the 1401 Protests
Then, an independent internet search was conducted for each of the counties, which caused the initial table to change by nearly 10%. However, given that the method of classifying counties is not clearly explained in the link above, there may be errors in the incorrect recording or omission of protests in some counties. If you find any issues, please point them out in the comments section.
The list of counties used in this study as counties with protests is provided in the appendix.
[12] p-value < 0.001
[13] p-value < 0.001
[14] The value of 65% was chosen to find counties where political representation has decreased by a significant margin from half. Choosing this number does not mean that values lower than it are not considered very high. A 50, 40, 30, or 20 percent decrease in political representation, especially occurring all at once, i.e., in two consecutive elections, is in itself high enough to potentially set the stage for political protests.
[15] For the changes in the leading presidential candidate's vote in 1400 (2021) compared to 1396 (2017) across all counties, refer to this link.
.

Discussion0 comments
No comments yet; let yours be the first voice.